Support and Troubleshooting
Monitoring NexentaStor Appliance Health
Several views are available to monitor the system health of a single node or a clustered appliance. To view the health summary, navigate to the following interface:
- Click the Nexenta Storage Systems menu item from the left navigation bar
- Select the appliance you want to view
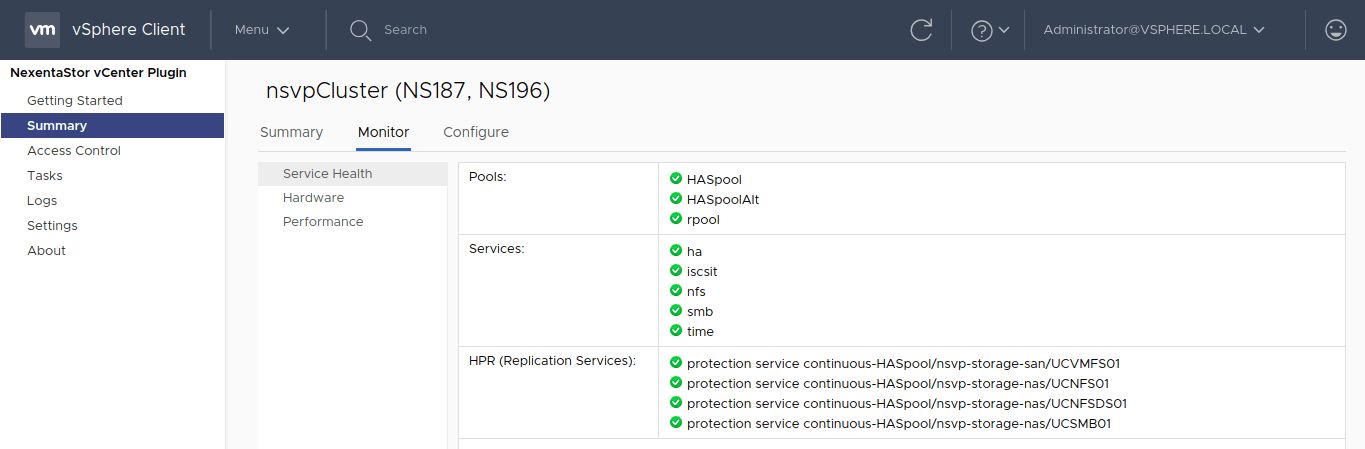
- Click the Monitor tab
Table “Health Monitoring Views”
| Role | Access Rights |
|---|---|
| Service Health summary | To get the health summary of all the services for each NexentaStor appliance: – Click the Service Health subtab. You will see the list of pools, appliance services, and HPR replication services running on the appliance. |
| Hardware health status | To view the hardware health status of individual NexentaStor appliances: – Click Hardware subtab. The vSphere Client display will show hardware information such as the node’s CPUs, network adapters, disks, enclosures, and adapters |
| Performance bottlenecks | To view the performance metrics of individual NexentaStor appliance that can indicate performance bottlenecks: – Click Performance subtab. The chart displays the following metrics. Latency Throughput IOPs Cache Hit Network Throughput CPU Capacity Allocated Capacity Free – Aggregated metrics for a single or a clustered pair of appliance. In the case of a clustered appliance, clicking on the Summary tab returns statistics for both member nodes as shown in Figure below. The resulting display shows he CPU utilization, network usage, cache hits, data reduction factors, number of volumes and file systems |